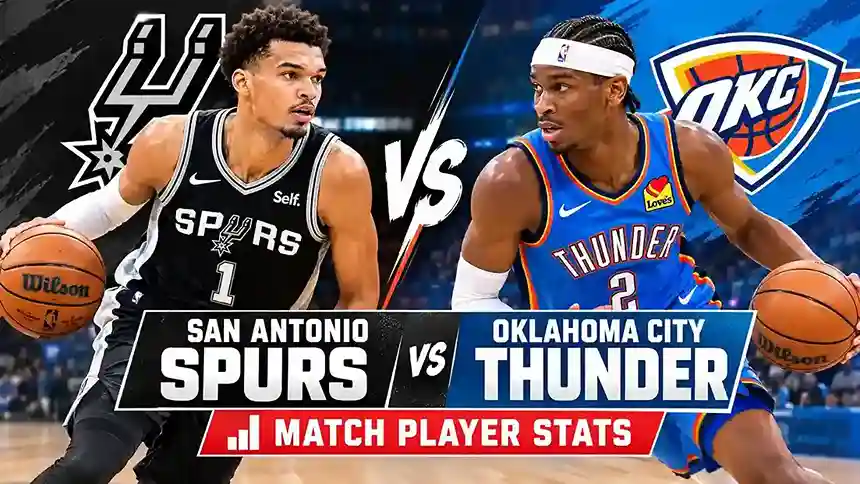
The latest San Antonio Spurs vs Oklahoma City Thunder match player stats show a rivalry where rebounding margins, free throw volume, turnover counts, and second-unit scoring decide games more often than any single dunk. A seven-game conference finals and a fresh season opener have given us more data than ever.
This breakdown walks through the newest results, a direct head-to-head comparison of the two stars, a full player table, and the shooting trends that explain why these two teams keep trading wins.
Latest Updates in the San Antonio Spurs vs Oklahoma City Thunder Match Player Stats
Three developments have changed how fans should read the numbers this year.
Season Opener: Thunder 116, Spurs 104
The 2026-27 schedule started with a rematch of the conference finals, and Oklahoma City took the first round. Gilgeous-Alexander scored 32 points with four assists, Jared McCain added 20 points on 6-of-8 three-point shooting, and the Thunder built a lead as large as 26 before halftime.
San Antonio won the second half by nine, led by Stephon Castle’s 24 points and seven rebounds, but the early hole was too deep. Victor Wembanyama finished with 12 points and 13 rebounds, yet he made only one field goal after missing his first twelve attempts, the coldest shooting start of his career. Oklahoma City shot about 45% from three as a team compared with 27% for the Spurs.
Western Conference Finals: Spurs Win in Seven
San Antonio eliminated the top-seeded Thunder 4-3, closing the series with a 111-103 road win. Oklahoma City had finished the regular season at 64-18 with Gilgeous-Alexander taking his second straight MVP, while San Antonio won 62 games. The Spurs then reached the NBA Finals, where they lost to New York.
Roster Changes That Shift the Stat Lines
Oklahoma City no longer has Luguentz Dort, Aaron Wiggins, or Isaiah Joe. Cason Wallace signed an extension, and McCain and Ajay Mitchell now carry larger roles. San Antonio added veteran forward Tobias Harris, re-signed Julian Champagnie, locked in Wembanyama on a five-year extension, and moved on from Jeremy Sochan, Kelly Olynyk, and Bismack Biyombo.
The next two meetings are both scheduled for Paycom Center, on Feb. 11 and March 14, and both are nationally televised.
Why This Rivalry Produces Such Explosive Player Performances
Two neighboring fan bases, two top-two seeds in the West, and two young cores peaking at the same time: the conditions here almost guarantee loud, high-effort basketball.
That intensity shows up in individual numbers. Players attack the rim with more force and take on bigger defensive assignments than they do against most Western Conference opponents.
The styles also clash in a useful way. Oklahoma City builds its offense around guard-led drives, pull-ups, and pressure defense that creates steals. San Antonio leans on Wembanyama’s size, Fox and Castle in the pick-and-roll, and a roster full of long defenders.
Because those philosophies collide, individual results swing hard. SGA scored 30 or more in several games of the conference finals, then shot 6-of-15 from the field in Game 4 when San Antonio overwhelmed Oklahoma City 103-82. The Thunder’s 82 points were their second-lowest postseason total ever.
That volatility is exactly why the Spurs vs Thunder player stats deserve a closer look than the final score alone provides.
Shai Gilgeous-Alexander vs Victor Wembanyama: The Head-to-Head Comparison
Every game between these teams turns on one question: can the MVP guard solve the league’s most disruptive defender? Their conference finals numbers give the clearest answer available.
| Stat (7-game series) | Shai Gilgeous-Alexander (OKC) | Victor Wembanyama (SAS) |
|---|---|---|
| Points per game | 25.9 | 27.3 |
| Rebounds per game | 2.9 | 10.9 |
| Assists per game | 8.9 | 3.1 |
| Steals per game | 1.9 | 1.4 |
| Blocks per game | 0.9 | 2.7 |
| Field goal % | 40.9% | 48.1% |
| Three-point % | 28.6% | 40.0% |
| Free throw % | 93.8% | 89.5% |
| Turnovers per game | 3.1 | 2.7 |
| Minutes per game | 37.9 | 37.7 |
Wembanyama won the efficiency battle on the floor, while SGA won it at the line and as a passer. Neither player dominated the other outright, which is why the series went the distance.
SGA’s Scoring Pressure
Gilgeous-Alexander shot only 40.9% in the series, yet he still averaged nearly 26 points. The reason is free throws: he made 61 of 65 attempts, a 93.8% clip that kept Oklahoma City’s offense afloat on nights when his jumper missed.
He also took on a heavier playmaking load than usual, dishing nearly nine assists per game. His best performance came in Game 7, when he scored 35 points and added nine assists, shooting 12-of-21 from the field and 9-of-11 from the line.
During the regular season he averaged 31.1 points, and in a mid-season win over San Antonio he put up 34 points and four blocks. The conference finals showed that the Spurs’ length can pull him below that standard, but not stop him.
Wembanyama’s Two-Way Impact
Wembanyama’s series line of 27.3 points, 10.9 rebounds, and 2.7 blocks came with 40% three-point shooting. His 41-point, 24-rebound opener in a double-overtime win set the tone, and he followed it with 33 in Game 4 and 28 in Game 6.
The defensive effect goes beyond blocks. Oklahoma City’s guards often passed up drives rather than test him, which explains why the Thunder shot just 42.6% as a team across the series. His regular-season marks of 25.0 points, 11.5 rebounds, and 3.1 blocks per game show how consistent that presence has been.
The season opener offered the Thunder’s best counter yet: they forced him into a one-for-thirteen night, even as he grabbed 13 rebounds.
Complete San Antonio Spurs vs Oklahoma City Thunder Match Player Stats Table
Context matters, so the table below uses the seven-game Western Conference Finals as the most recent full sample of these two rosters.
| Player | Team | PPG | RPG | APG | FG% | 3P% | STL / BLK |
|---|---|---|---|---|---|---|---|
| Victor Wembanyama | SAS | 27.3 | 10.9 | 3.1 | 48.1% | 40.0% | 2.7 BLK |
| Shai Gilgeous-Alexander | OKC | 25.9 | 2.9 | 8.9 | 40.9% | 28.6% | 1.9 STL |
| Stephon Castle | SAS | 18.0 | 5.0 | 7.6 | 46.5% | 23.3% | 1.3 STL |
| Alex Caruso | OKC | 14.9 | 2.4 | 2.6 | 47.7% | 50.0% | 1.3 STL |
| Devin Vassell | SAS | 13.9 | 4.9 | 2.4 | 40.3% | 39.6% | 1.7 STL |
| Jared McCain | OKC | 13.1 | 2.9 | 1.6 | 36.6% | 28.3% | 0.7 STL |
| Dylan Harper | SAS | 12.0 | 5.7 | 3.3 | 46.0% | 35.0% | 1.0 STL |
| Julian Champagnie | SAS | 11.9 | 6.1 | 1.6 | 40.8% | 32.7% | 1.1 STL |
| Chet Holmgren | OKC | 10.7 | 7.1 | 1.0 | 51.0% | 27.3% | 1.1 BLK |
| Cason Wallace | OKC | 10.1 | 4.7 | 2.7 | 49.0% | 50.0% | 2.6 STL |
Two details stand out. First, Castle’s 7.6 assists per game show how much San Antonio relies on him as a creator, though his 4.6 turnovers per game were a real cost. Second, Oklahoma City got elite three-point shooting from Caruso and Wallace, who each hit half of their long-range attempts.
De’Aaron Fox appeared in five games and averaged 11.2 points, 5.2 rebounds, and 6.2 assists on 36.5% shooting, and his availability remains one of the biggest swing factors for San Antonio.
Bench Players Who Quietly Swing These Games
Starters collect the headlines, but this series made clear that depth often decides who leaves with the win. Both sides use deep rotations, and the most crucial moments in a game are when there are no stars on the court.
Thunder Second-Unit Impact
Caruso was the best reserve on either side, averaging 14.9 points and knocking down 20 of 40 threes. McCain added 13.1 points per game, and in the season opener he scored 20 with six threes, a sign that his role has only grown.
Jaylin Williams contributed 6.4 points and 5.3 rebounds in limited minutes, and he provided 11 points in the Game 7 loss. With Dort, Wiggins, and Joe gone, Mitchell and Wallace are expected to absorb more of the rotation’s scoring and defense, and Mitchell is already a preseason candidate for Sixth Man of the Year.
Spurs’ Young Reserves and Veterans
San Antonio’s reserve group blends youth and experience. Keldon Johnson, the 2026 Sixth Man of the Year, averaged 9.9 points in just 18.7 minutes during the series. Harper, who started only two games, produced 12.0 points and 5.7 rebounds in 26.2 minutes and set a playoff franchise record with seven steals in Game 1.
Luke Kornet and Carter Bryant add size and spacing behind them, and Harris adds veteran scoring depth to the rotation. Together, these players keep San Antonio within reach when the starters rest.
Shooting Splits and Advanced Metrics Worth Knowing
Raw point totals hide the strategy underneath. The shooting splits from the conference finals show two teams that were nearly identical in efficiency.
| Team stat (per game) | Spurs | Thunder |
|---|---|---|
| Points | 112.7 | 109.0 |
| Field goal % | 43.5% | 42.6% |
| Three-point % | 34.1% | 34.4% |
| Free throw % | 83.4% | 84.3% |
| Total rebounds | 46.9 | 42.4 |
| Offensive rebounds | 13.6 | 11.4 |
| Assists | 24.9 | 25.9 |
| Steals | 9.3 | 10.1 |
| Blocks | 5.9 | 4.4 |
| Turnovers | 16.0 | 14.3 |
| Free throw attempts | 26.7 | 23.7 |
San Antonio won the glass and the foul line. Oklahoma City won the turnover battle and the steals column. That split matches the identity of each team.
Three-Point Shooting Showdown
Both offenses landed almost exactly the same percentage from deep, so the difference came from who was shooting. Wembanyama hit 40%, Vassell hit 39.6% on 53 attempts, and Caruso and Wallace both hit 50%.
The cold spots were just as telling. SGA shot 28.6% from three, Castle shot 23.3%, and McCain shot 28.3%. The opener repeated the pattern: Oklahoma City’s 45% from three against San Antonio’s 27% decided the first half.
Paint Dominance and the Free Throw Battle
Contrary to the common assumption that Oklahoma City wins at the line, San Antonio actually attempted about three more free throws per game in the series. Wembanyama alone got to the line 57 times, and SGA 65 times, so the two stars account for much of the total.
Offensive rebounding gave the Spurs another edge. Their 95 offensive boards compared with 80 for Oklahoma City produced extra possessions that offset their higher turnover count. For the Thunder, the answer was pressure: their defense forced more mistakes and turned them into transition points.
How Player Stats Have Shifted Over the Last Five Seasons
Five years ago, neither franchise looked like a threat to the other. Oklahoma City was deep in a rebuild, and San Antonio was working through the post-Duncan era with a roster that lacked a true franchise piece.
The arrival of Gilgeous-Alexander as a lead guard and Wembanyama as a generational center changed everything. The Thunder won 68 games and a championship over Indiana in seven games, then followed up with 64 wins and a second straight MVP for SGA. After Gregg Popovich resigned after 29 seasons, first-year head coach Mitch Johnson led the Spurs to 62 victories.
The individual numbers moved with those results. Both teams now sit near the top of the league in the categories that matter in this matchup: Wembanyama leads the conference finals in rebounds, SGA leads in assists, and each side plays at a pace that creates more counting stats than the slower games of the rebuild era.
What These Numbers Mean for the Road Ahead
Every match player stat between these teams matters because they keep meeting at the highest level. The Spurs have the playoff edge for now, since they beat Oklahoma City in seven games, while the Thunder opened the new season with a convincing win at San Antonio.
For Oklahoma City, the key is depth. Caruso, McCain, Wallace, and Mitchell give them multiple scorers who can take pressure off SGA, and their defense produces steals and easy points.
For San Antonio, the key is health and balance. When Wembanyama, Fox, Castle, and Harper are all available, the Spurs have more length and rebounding than any team in the conference. Their challenge is protecting the ball, because turnovers have been their most consistent weakness in this series of games.
The free throw and rebounding battles will likely decide the next meetings, and both are circled on the calendar in February and March.
Final Thoughts on the Spurs vs Thunder Player Stats Story
The San Antonio Spurs vs Oklahoma City Thunder match player stats describe a rivalry that has moved from promising to elite. The newest chapter, with a seven-game series win for San Antonio and an opening-night response from Oklahoma City, proves that neither team has found a permanent solution.
SGA’s scoring and playmaking against Wembanyama’s rim protection and shooting remains the defining matchup, but the supporting cast now carries more weight than ever. Castle, Harper, Caruso, McCain, and Wallace all have the ability to turn a close game.
If you want to understand the next meeting before it happens, watch the rebounds, the turnovers, and the free throw counts. Those numbers have told the story more honestly than any highlight clip.